
The Glycaemic Index and Glycaemic Load: What They Mean for Eating Plans

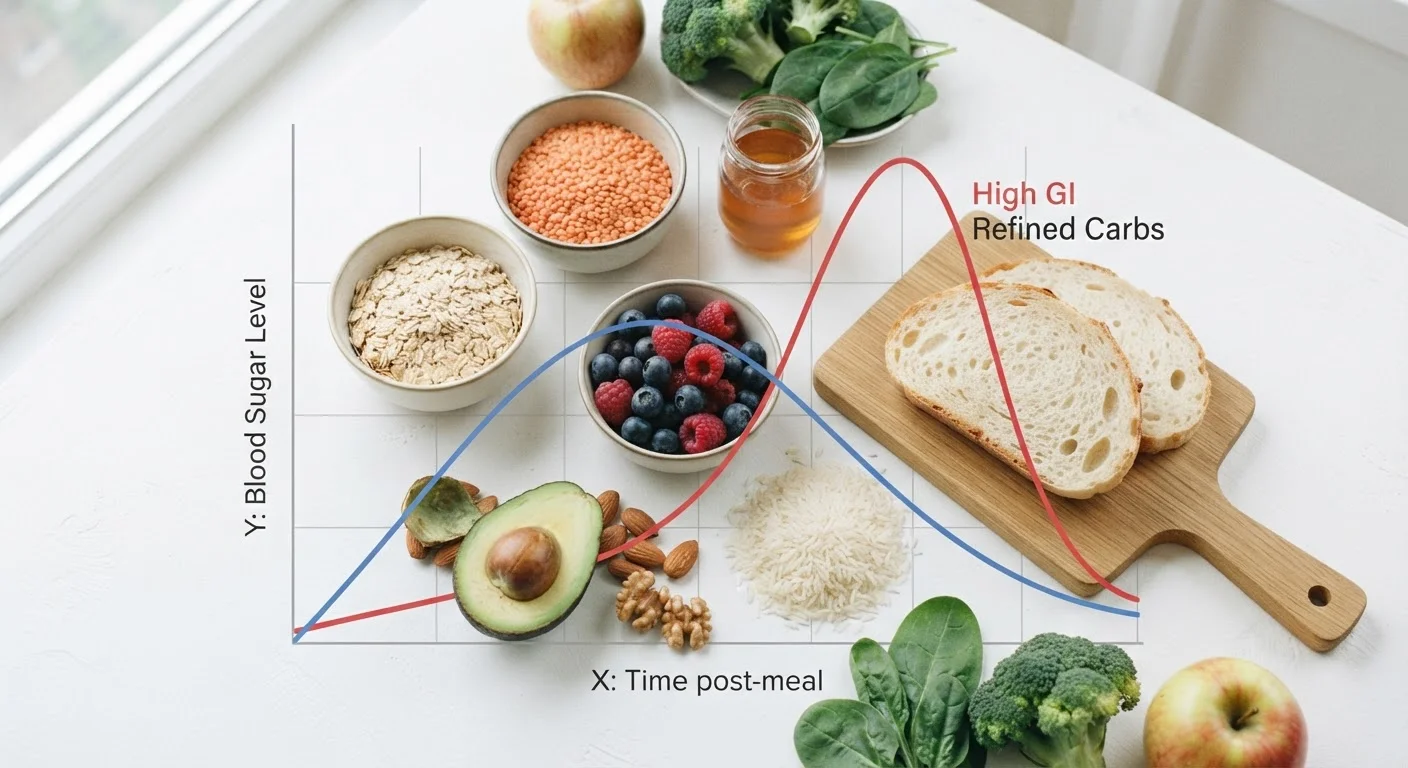
Photo: HerbHealWellness.com | Modern Guide To Wellness editorial
Key Takeaways
- GI measures how quickly a food raises blood glucose; GL accounts for serving size as well.
- A food can have a high GI but a low GL when a typical portion contains few carbohydrates.
- Cooking method, ripeness, and food combinations all affect a food's real-world GI.
- Low-GI diets are associated with improved blood glucose control in research, though individual responses vary.
- GI and GL are tools for context — they work best alongside broader dietary patterns, not in isolation.
What GI and GL Actually Measure
Glycaemic index was developed in the early 1980s by researcher David Jenkins and colleagues as a way to rank carbohydrates by their physiological effect rather than their chemical structure. Before GI, dietary advice treated all complex carbohydrates as equivalent — a simplification that research showed was inaccurate.
The GI of a food is measured by having study participants eat a standardized portion and tracking blood glucose responses over two hours, then comparing those readings against pure glucose (GI = 100). White bread is sometimes used as an alternative reference food at GI = 100.
Glycaemic load was introduced later to address a clear limitation: a food could score high on GI but be eaten in such small portions that its real-world blood sugar impact was modest. Watermelon, for example, has a GI around 72 — classified as high — but a standard 120 g serving contains relatively few available carbohydrates, giving it a GL of roughly 4, which is low. The formula is straightforward: GL = (GI × grams of available carbohydrate per serving) ÷ 100. A GL under 10 is considered low; 20 or above is high.
GI Values Are Population Averages
Factors That Shift a Food's GI
GI is not a fixed property stamped onto an ingredient at the farm. Several variables shift the number considerably:
- Processing and particle size: Finely milled flours produce higher GI products than stone-ground or intact grain equivalents because digestion proceeds faster.
- Cooking: The more a starch is gelatinized by heat and moisture, the more rapidly it is digested. Al dente pasta has a measurably lower GI than fully cooked pasta.
- Ripeness: A ripe banana has a higher GI than an underripe one, as starch converts to sugars during ripening.
- Food combinations: Fat, protein, and soluble fiber slow gastric emptying and blunt glucose spikes. A baked potato eaten with sour cream and cheese will produce a different response than the same potato eaten plain.
- Individual biology: Emerging research, including continuous glucose monitoring studies, confirms that people's postprandial (after-meal) glucose responses to identical foods vary substantially based on gut microbiome, insulin sensitivity, and other factors.
Pair Carbohydrates With Protein or Fat
How Eating Plans Use GI and GL
Several structured dietary frameworks explicitly incorporate GI and GL concepts. The low-GI diet label is perhaps the most direct application: it steers people toward minimally processed grains, legumes, non-starchy vegetables, and most fruits while reducing refined starches and added sugars.
The broader Mediterranean and DASH (Dietary Approaches to Stop Hypertension) eating patterns are not explicitly GI-based, but their emphasis on whole grains, legumes, and vegetables means their carbohydrate sources tend to cluster in the low-to-medium GI range.
Research published in journals including The Lancet and Diabetes Care has found associations between low-GI dietary patterns and improved glycaemic control, lower LDL cholesterol, and modest reductions in cardiovascular risk markers. However, researchers note that disentangling GI effects from the overall quality of a diet — which tends to improve when people choose lower-GI foods — is methodologically challenging. Most nutrition scientists view GI and GL as useful but incomplete tools.
~50%
GI reduction: white bread vs. legumes
Legumes such as lentils and chickpeas typically have GI values 40–55 points lower than refined white bread, according to the University of Sydney's GI database.
0.5 mmol/L
Average fasting glucose reduction on low-GI diets
A Cochrane systematic review found low-GI or low-GL diets were associated with approximately 0.5 mmol/L reductions in fasting blood glucose in people with type 2 diabetes.
This article is for general informational purposes only and does not constitute medical or dietary advice. Consult a registered dietitian or qualified healthcare professional before making changes to your eating plan, particularly if you have a medical condition such as diabetes.
Frequently Asked Questions
The content on this site is for informational purposes only and is not a substitute for professional advice. Always consult a qualified professional for guidance specific to your situation.